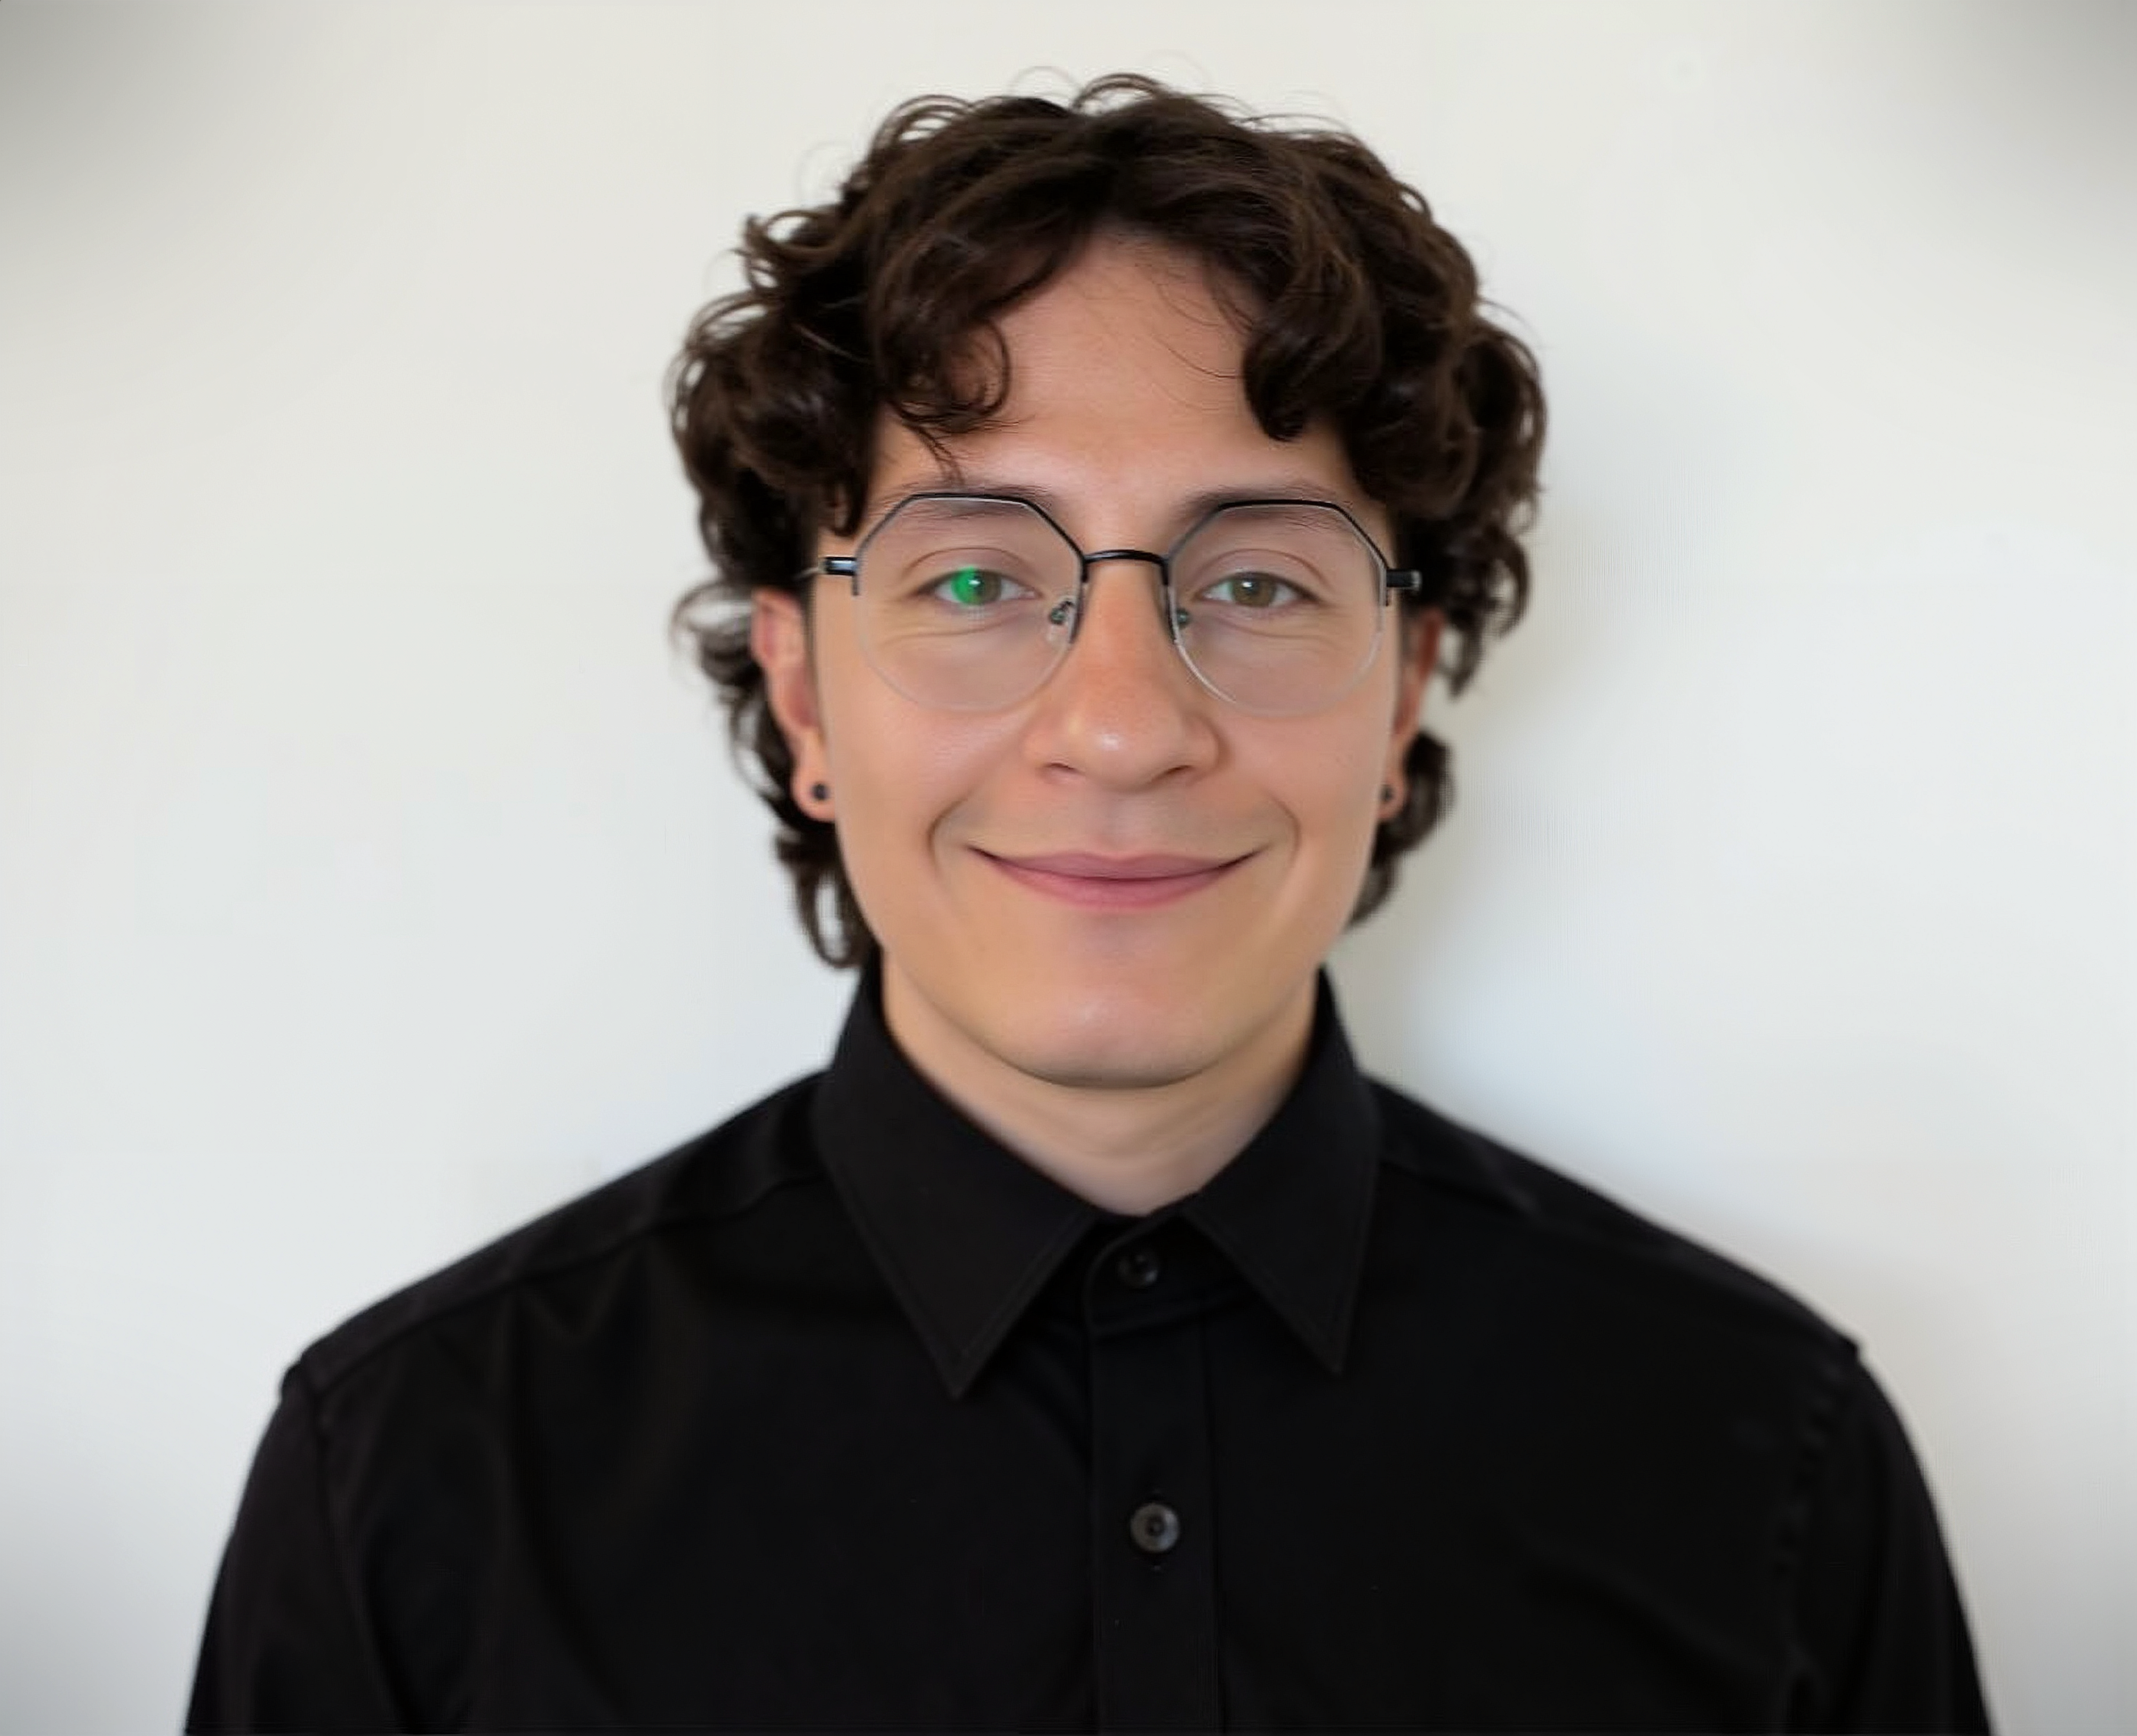
I didn’t start my career in data. I started in the laboratory.
For six years I worked in pharmaceutical and research labs, building a foundation in biology, analytical chemistry, and quality systems before starting a Master’s in Biostatistics. Working directly with scientific data taught me something that still shapes how I work: every dataset has a story behind it. How the data were collected, where the variability comes from, what can quietly bias a result — that context matters as much as the model you choose.
Since moving into biostatistics, I’ve focused on turning that instinct into method. I work primarily in R and Python for analysis and visualization, and I build interactive applications with Shiny and PyShiny so results are legible to technical and non-technical audiences alike. My interests run to clinical research, survival analysis, experimental design, and healthcare analytics.
I’m completing my degree while building a portfolio of projects that combine statistics, SQL, visualization, and domain knowledge. The goal is straightforward: help clinical and pharmaceutical teams make decisions that hold up and that ultimately improve patient outcomes.
Outside work and school, I’m usually trying a new recipe, baking, or learning something with nothing to do with statistics. Cooking has more in common with research than it looks: it rewards understanding the process, minding the details, and knowing when it’s safe to experiment.
Skills & Tools
Statistical analysis — regression, ANOVA, mixed models, survival analysis, experimental design
Programming — R, SQL, Python, Git/GitHub
Visualization — Power BI, Tableau, Shiny, PyShiny
Domain expertise — biostatistics, clinical research, pharmaceutical analytics, public health, laboratory operations